Custom Dashboards
Every number you need, in one clear view
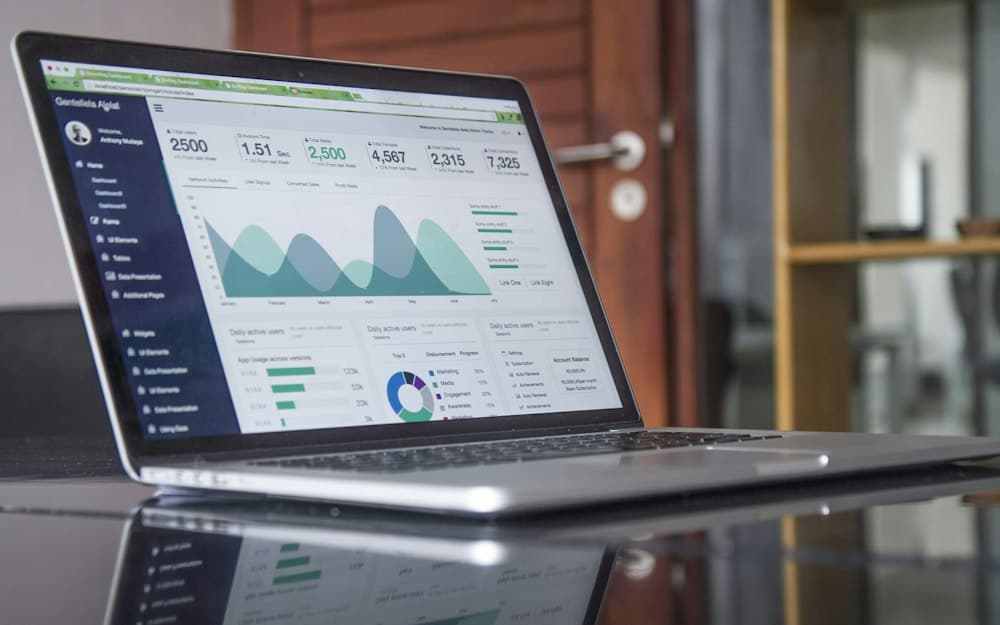
We build real-time dashboards that pull data from all your systems, so leaders and teams can make decisions without waiting for reports.
The problem
Decisions wait on spreadsheets
Key numbers live in different systems, reports take days to compile, and by the time they arrive they're already out of date.
- Reports compiled by hand every week
- Different teams quote different numbers
- No live view of what's happening today
What we deliver
Everything you need, from one team
Executive dashboards
The handful of KPIs that matter, updated automatically.
Operational dashboards
Live views for sales, finance, operations and support teams.
Data integration
CRM, ERP, accounting, spreadsheets and databases in one model.
Threshold alerts
Get notified when a metric moves outside the range you care about.
Role-based access
Everyone sees the data they need — and nothing they shouldn't.
On any device
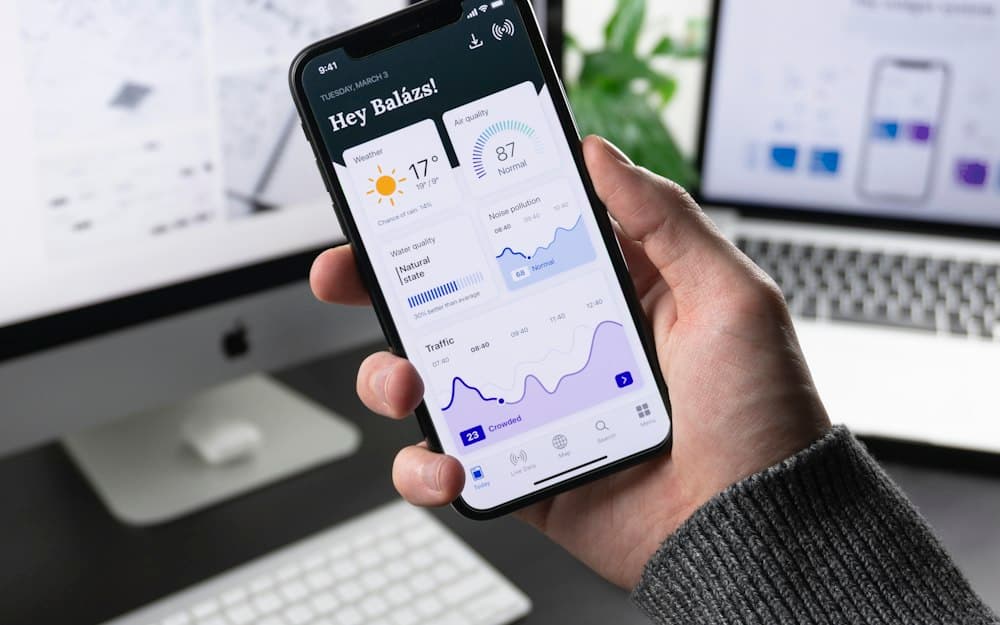
Dashboards for desktop, tablet and mobile — or embedded in your own app.
How it works
A clear path from idea to results
- 1
Step 1: Define the questions
Agree the KPIs, their definitions and who needs to see what.
- 2
Step 2: Connect the data
Reliable pipelines and a clean data model across your sources.
- 3
Step 3: Design & build
Prototype, review with real users and refine.
- 4
Step 4: Roll out & train
Launch, training and a simple process for new requests.
What this looks like in practice
Real-time BI dashboards that turn raw data into clear decisions.
One version of the truth
Every team works from the same definitions and the same live numbers.
The Monday report, automated
Leadership gets the weekly numbers automatically, without anyone building a spreadsheet.
Problems spotted early
Threshold alerts flag issues the same day, not at month-end.
Illustrative examples of the kind of results this service is designed to deliver.
Technologies we use
- Power BI
- Microsoft Azure
- PostgreSQL
- Python
- React
- Next.js
FAQ
Common questions
Power BI or a custom-built dashboard?
Power BI is ideal if you already use Microsoft 365 and want self-service analytics. A custom web dashboard suits customer-facing portals or bespoke visuals. We'll recommend the right fit.
Can you connect to our existing systems?
Almost certainly. We regularly connect CRMs, ERPs, accounting tools, databases and spreadsheets via APIs or scheduled exports.
How often is the data updated?
Anywhere from real time to daily, depending on your sources and needs. Most operational dashboards refresh every few minutes.
Who maintains the dashboards?
We can maintain them for you, or train your team to add and adjust reports themselves.
Related services



Where is your team losing time?
Tell us what you want to build or fix. We'll come back with practical next steps and an honest view of cost and timeline.